'Strong Earthquake Monitor' displays earthquake tremors across Japan in real time
The Strong Earthquake Monitor , released by the National Research
Strong earthquake monitor
http://www.kmoni.bosai.go.jp/
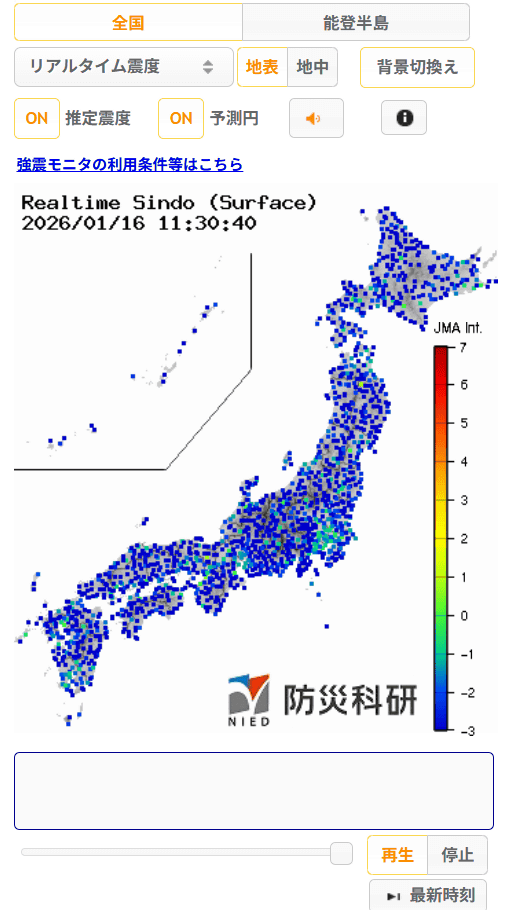
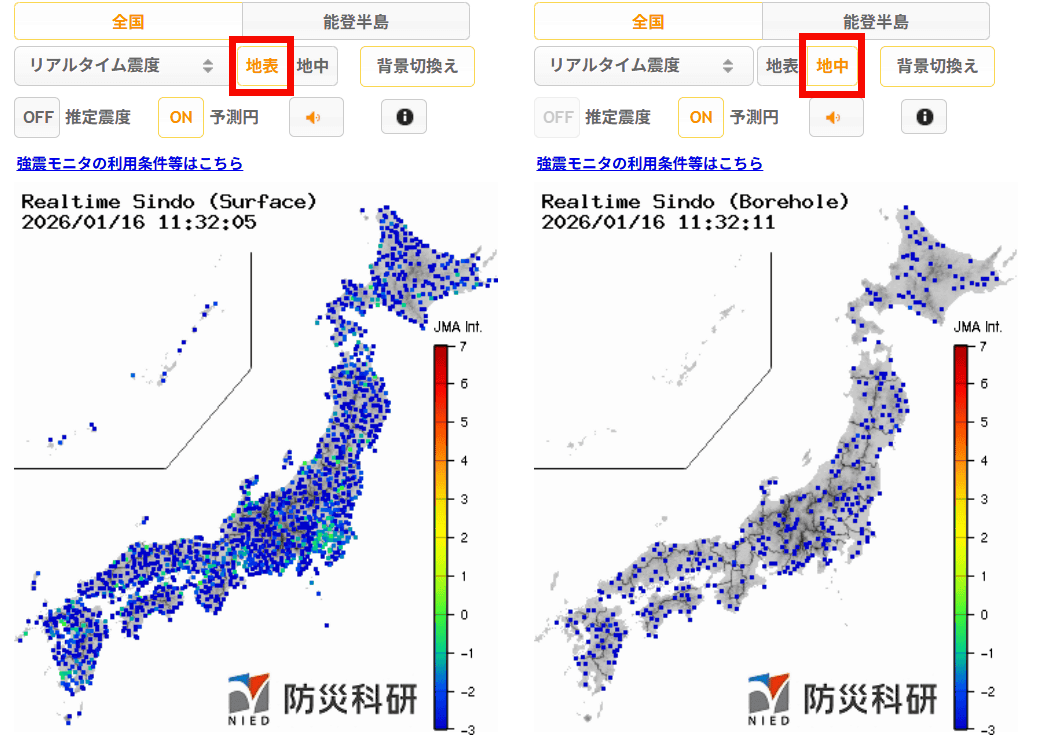
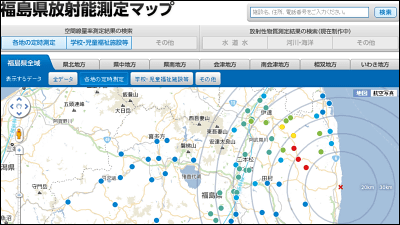
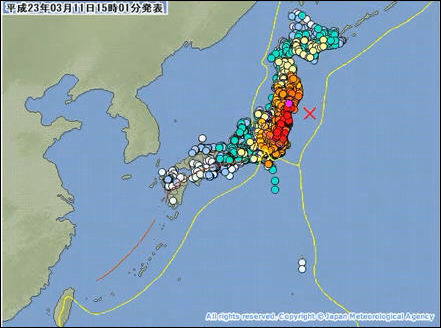
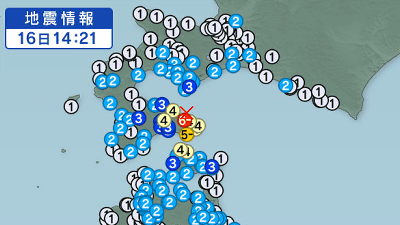
The strong earthquake monitor looks like this: Real-time seismic intensity is displayed as colored dots on a map of Japan.
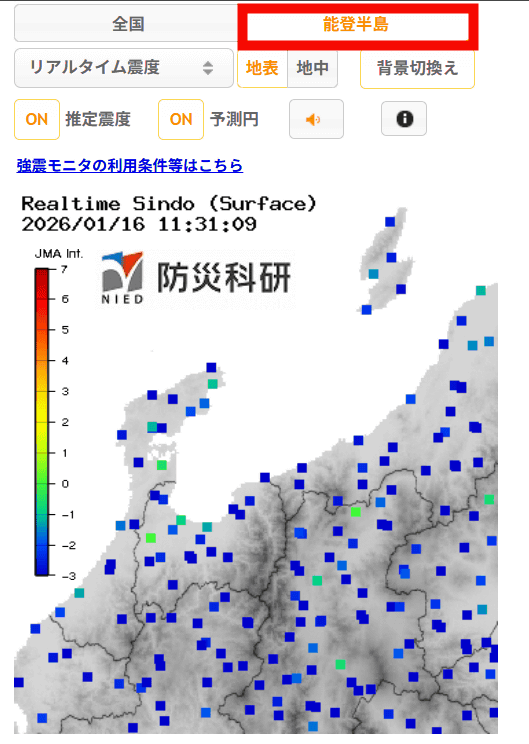
By selecting 'Noto Peninsula' from the tab at the top, you can switch to a map with a close-up of the Noto Peninsula.
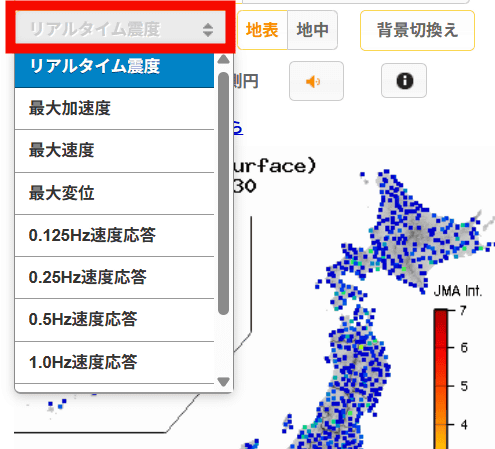
The 10 indicators that can be displayed on the map are 'real-time seismic intensity,' 'maximum acceleration,' 'maximum velocity,' 'maximum displacement,' '0.125Hz velocity response,' '0.25Hz velocity response,' '0.5Hz velocity response,' '1.0Hz velocity response,' '2.0Hz velocity response,' and '4.0Hz velocity response.'
You can also switch between viewing surface data and underground data.
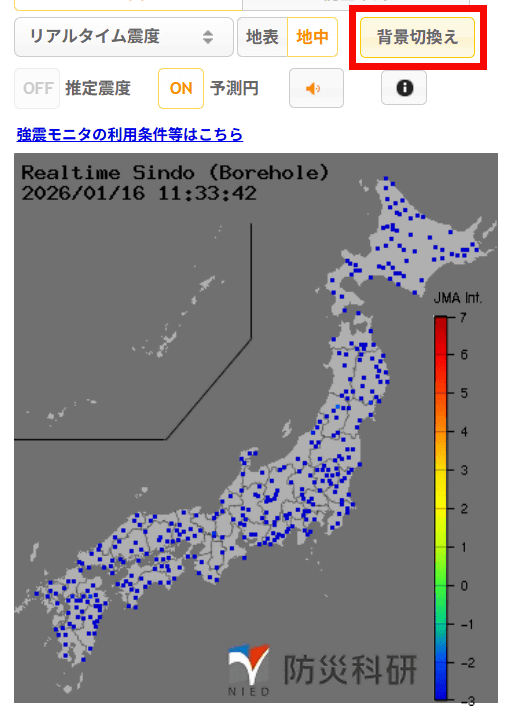
When I clicked 'Switch Background', the background of the map of Japan changed from white to gray.
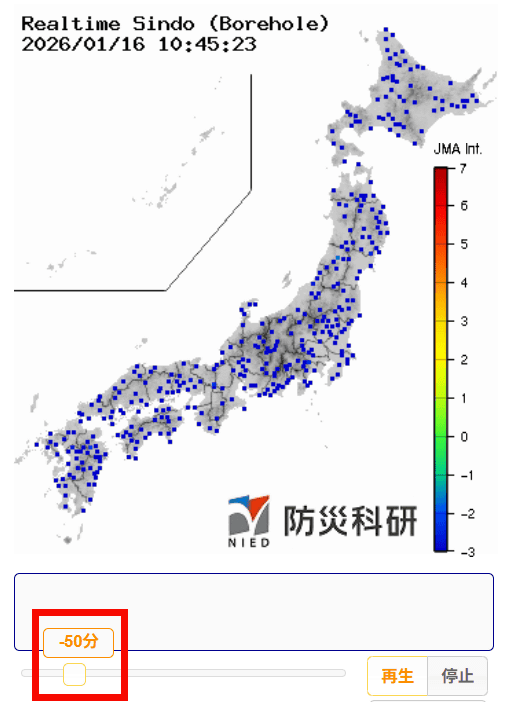
On the Strong Motion Monitor, by moving the slide below the map, you can view real-time data in one-second increments going back up to one hour from the time you are viewing the page.
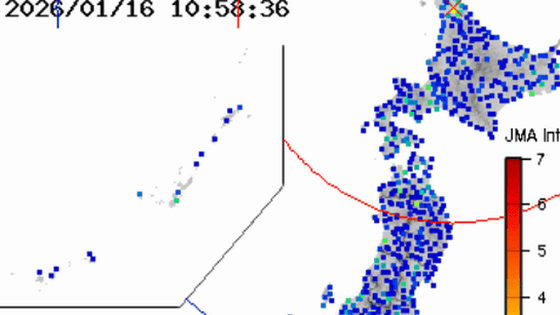
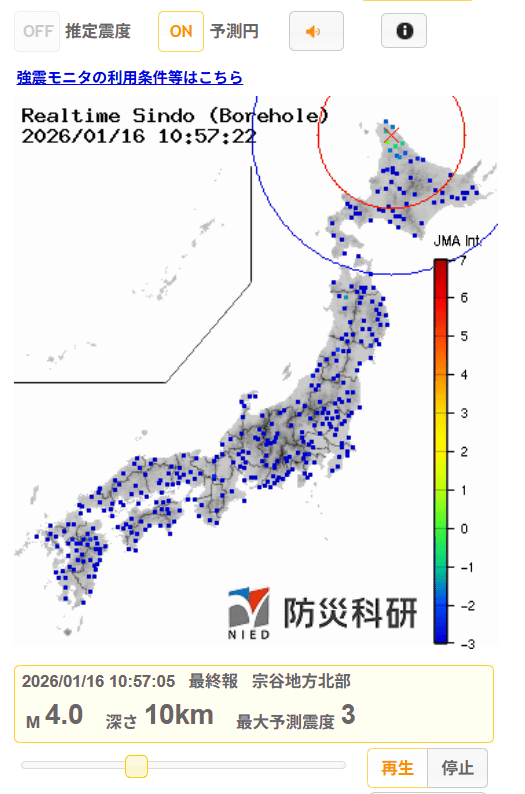
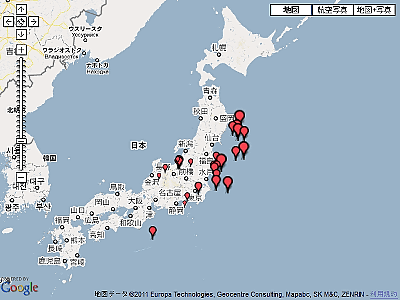
While reviewing the data going back in time, I found information about
Related Posts:

in Web Service, Review, Posted by log1e_dh