Cloudflare's report reveals various statistics on the Internet, such as 'ChatGPT is popular in Japan,' '57% of traffic in Japan is iOS devices,' and 'Global traffic will increase by 19% by 2025.'

Cloudflare has released
Cloudflare Radar 2025 Year in Review
https://radar.cloudflare.com/year-in-review/2025
The 2025 Cloudflare Radar Year in Review: The rise of AI, post-quantum, and record-breaking DDoS attacks
https://blog.cloudflare.com/radar-2025-year-in-review/
Cloudflare operates an extensive network with offices in 330 cities in over 125 countries and regions around the world, handling an average of over 81 million HTTP requests per second and peaking at over 129 million per second on behalf of millions of websites, as well as handling approximately 67 million DNS queries per second.
Cloudflare Radar combines data generated from these vast web and DNS services with complementary datasets to provide near real-time visibility into traffic, bot, security, connectivity, and DNS patterns and trends observed across the internet.
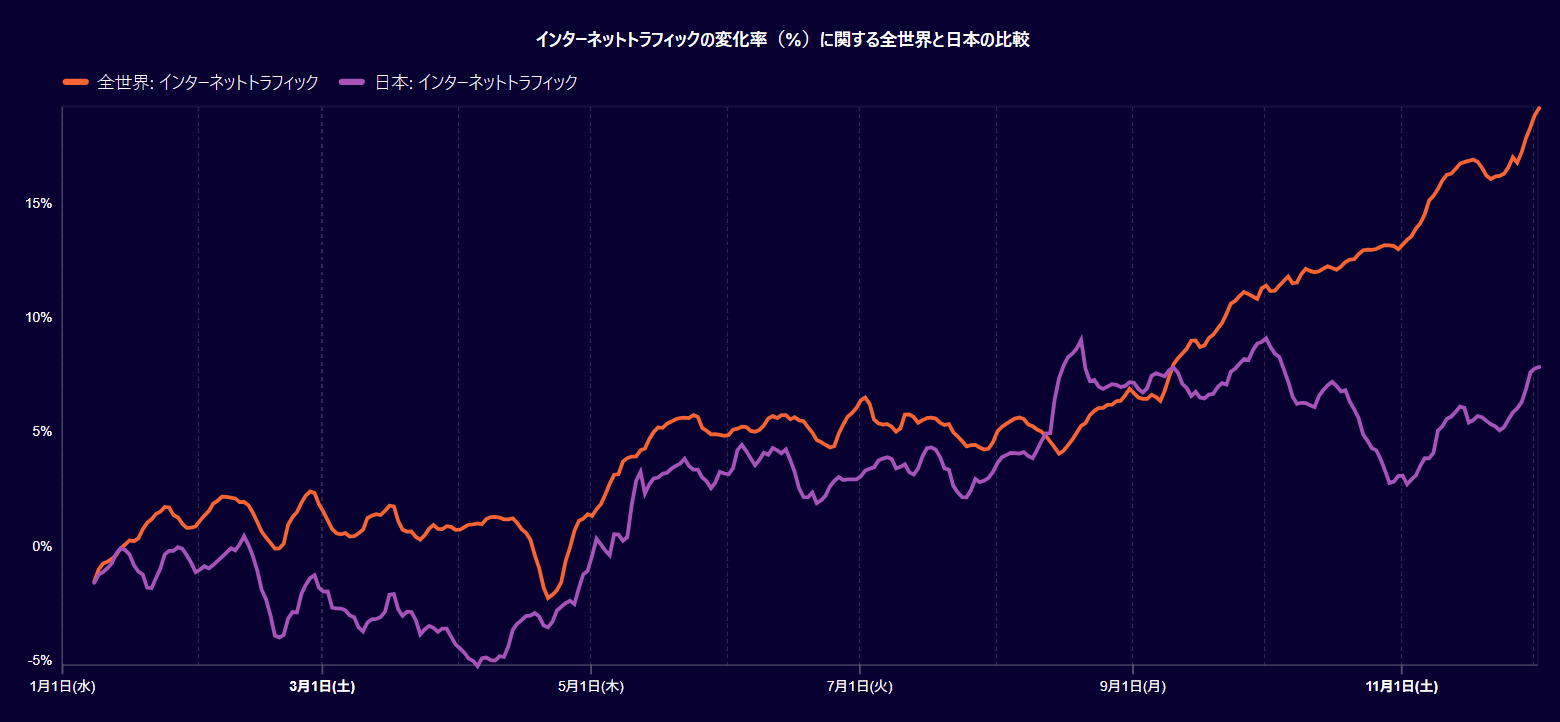
◆Traffic trends
The graph below shows the change in traffic from the beginning of the year after the holiday. The orange line represents global traffic, and the purple line represents Japan. Globally, traffic increased by 19.3% as of December 2, 2025, while Japan alone saw a 7.9% increase.
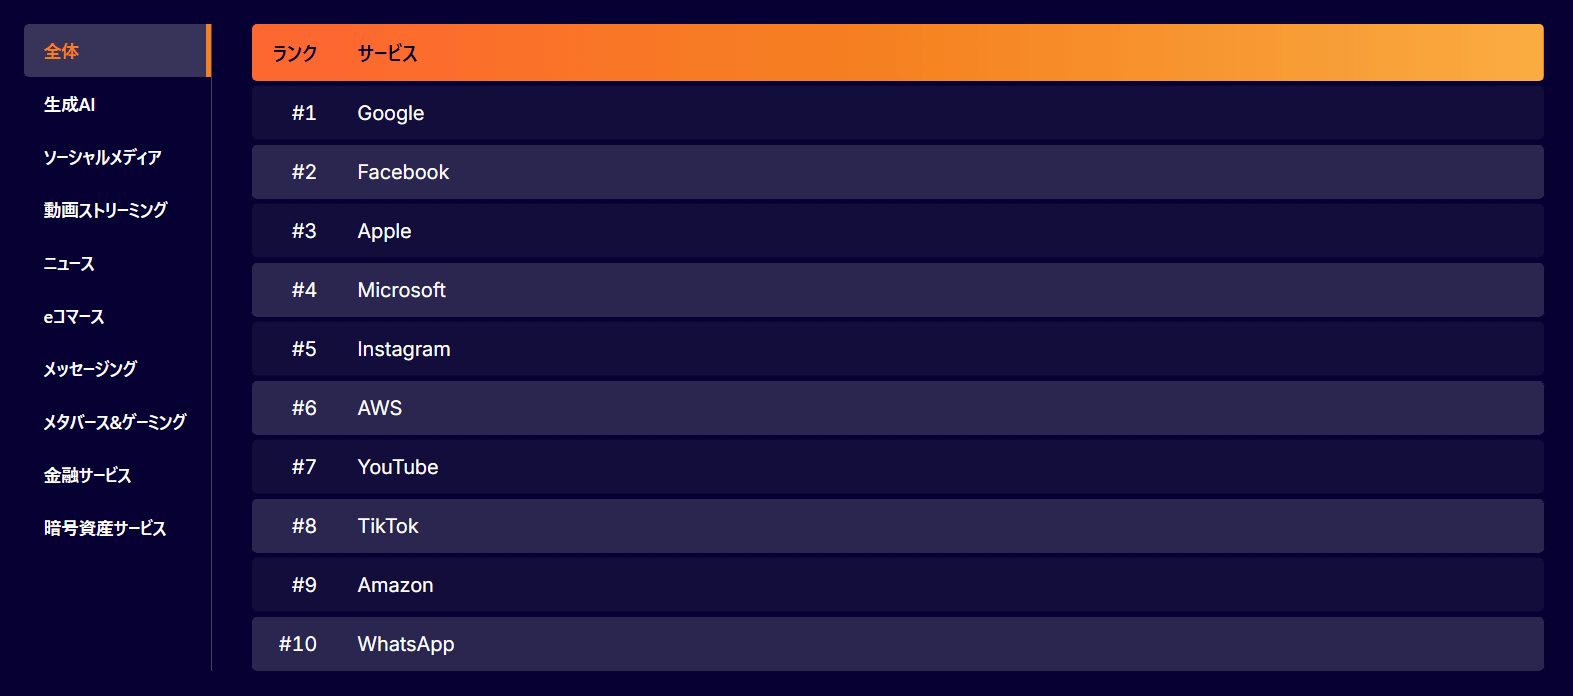
◆The most popular internet service in the world
Globally, Google was the most popular overall internet service, followed by Facebook, Apple, Microsoft, Instagram, AWS, YouTube, TikTok, Amazon and WhatsApp.
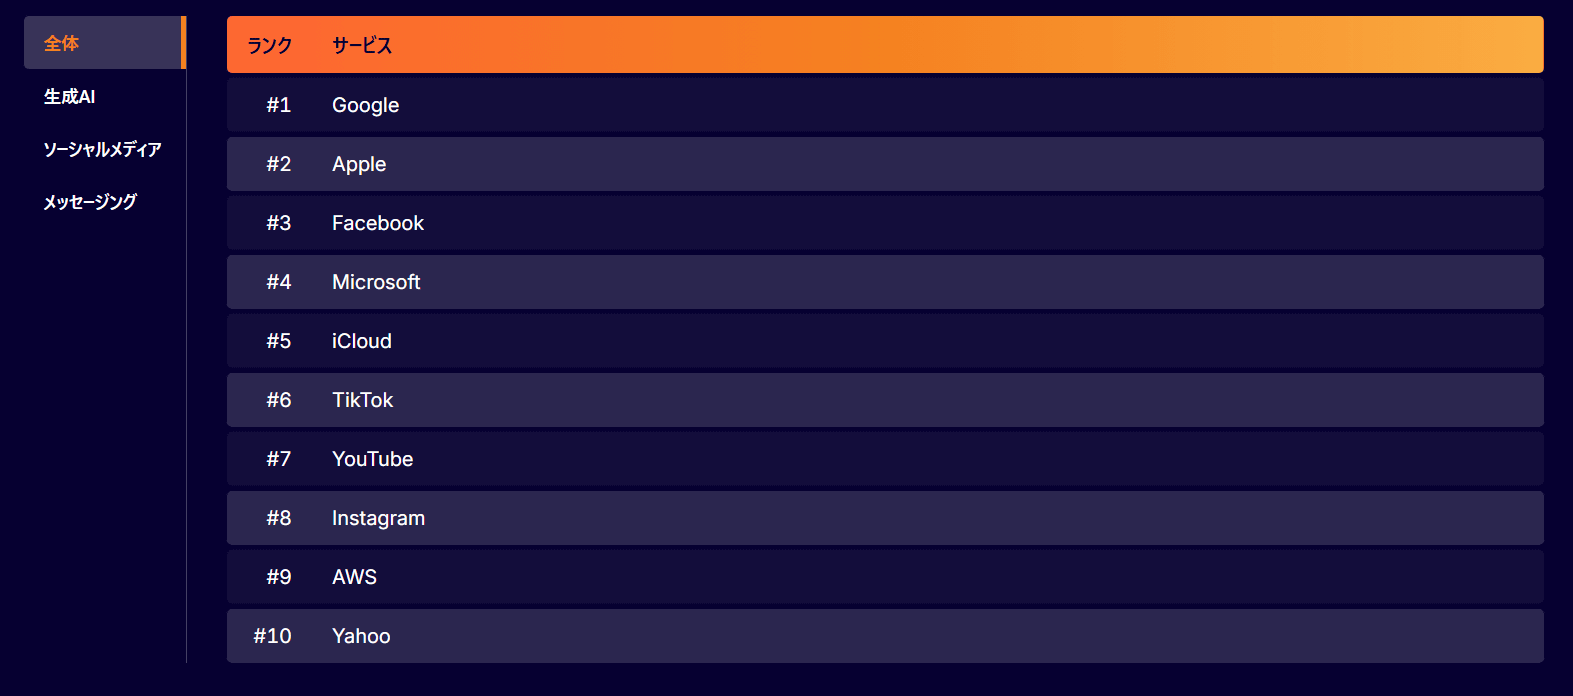
In Japan, Google remains in first place, but Apple is in second place. iCloud is in fifth place, Yahoo is in tenth place, and Amazon is not ranked.
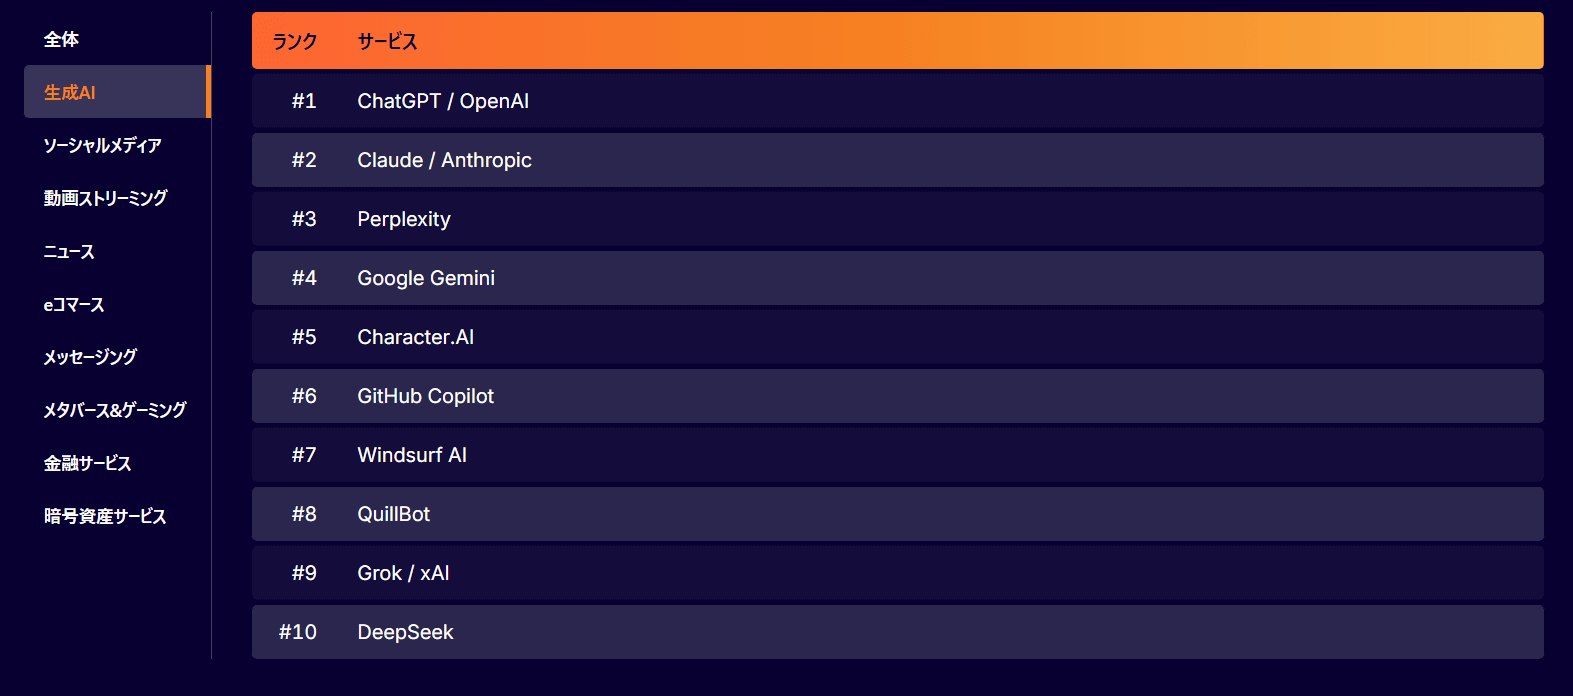
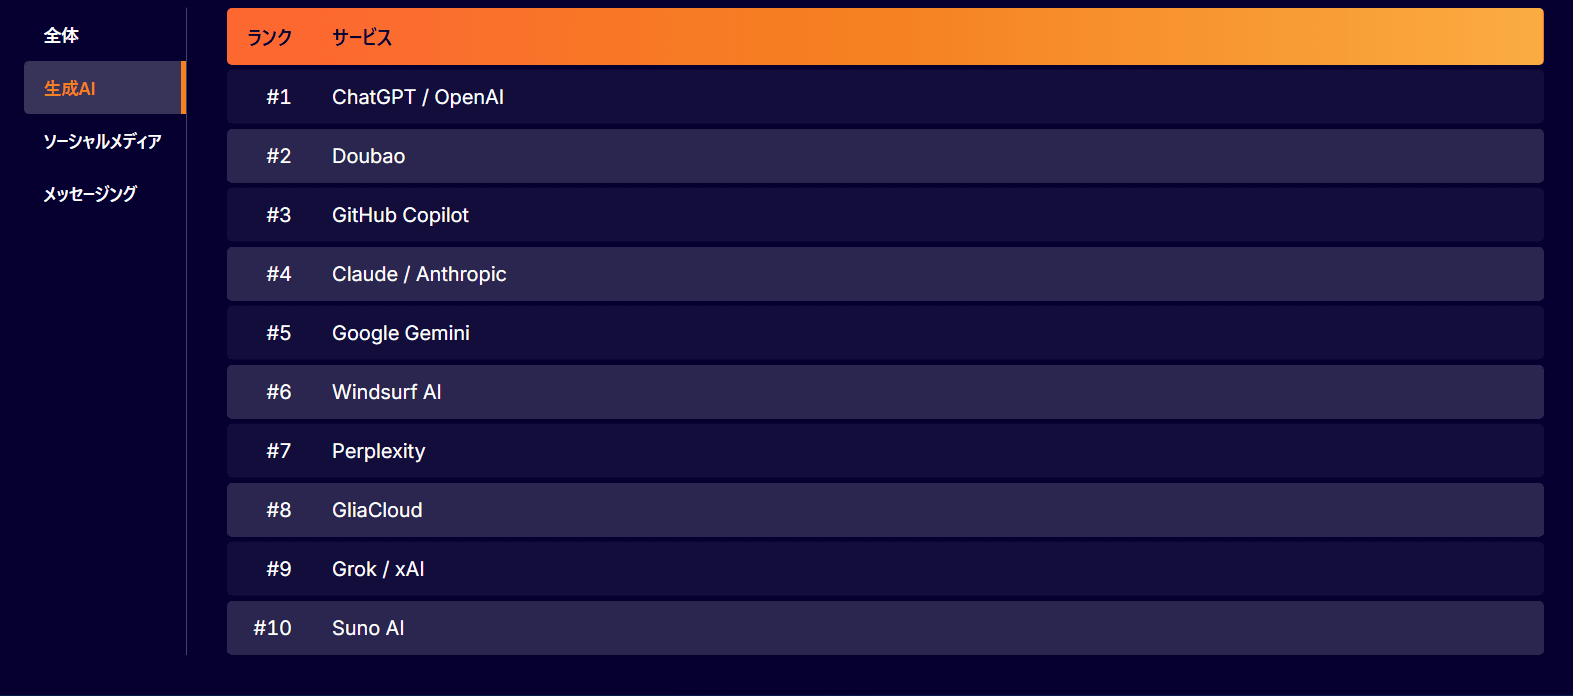
In the global rankings for generative AI, ChatGPT takes first place, followed by Claude, Perplexity, Google Gemini, Character.AI, GitHub Copilot, Windsurf AI, QuillBot, Grok, and DeepSeek.
And while ChatGPT remains at number one in Japan's generative AI rankings, the rankings after that are quite different. Coming in at number two is 'Doubao' from ByteDance. Also, at number eight is 'GilaCloud,' a Taiwanese video-generating AI service.
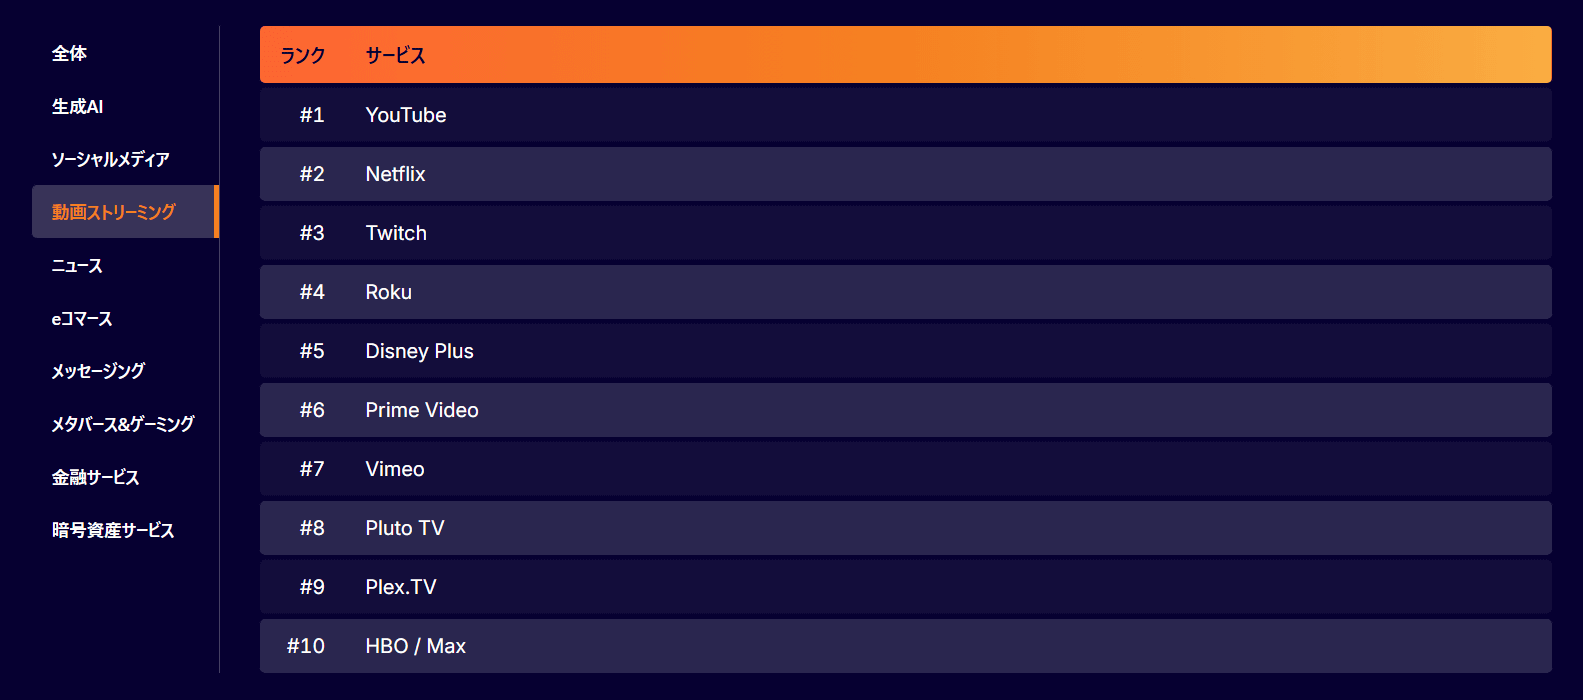
The global ranking also includes video streaming services, with YouTube taking first place, Netflix second, and Twitch third.
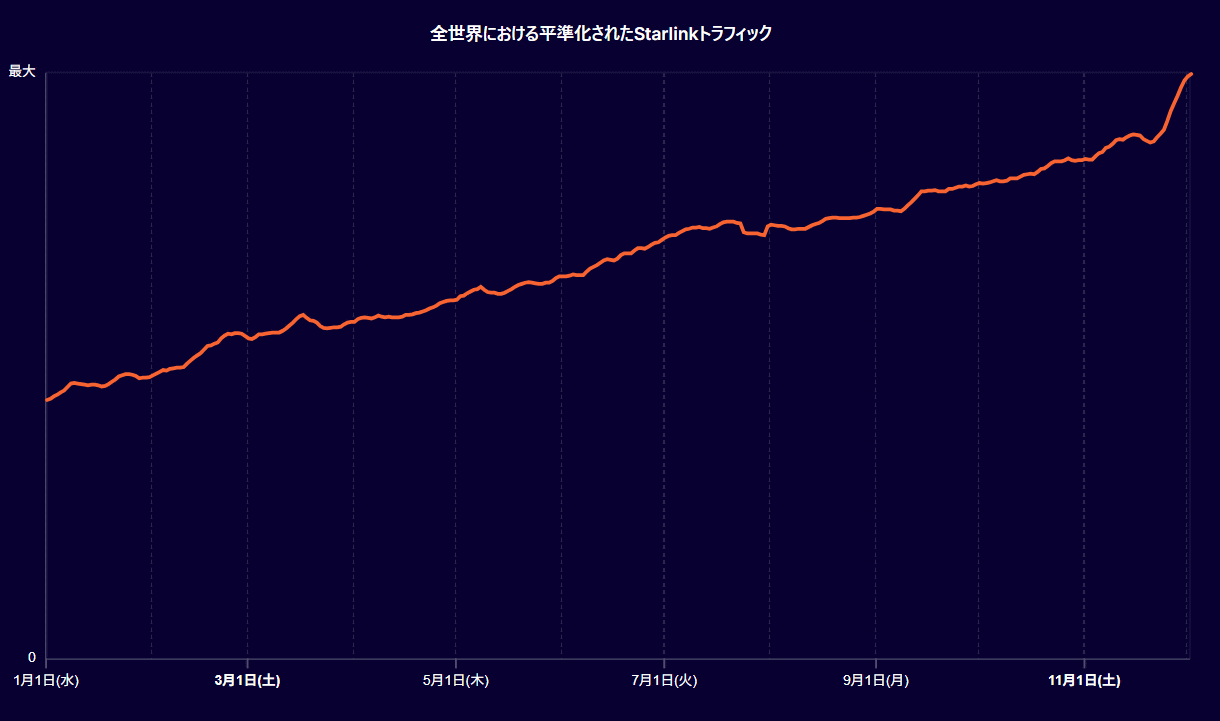
◆SpaceX Starlink traffic trends
A graph summarizing request traffic from the autonomous system (
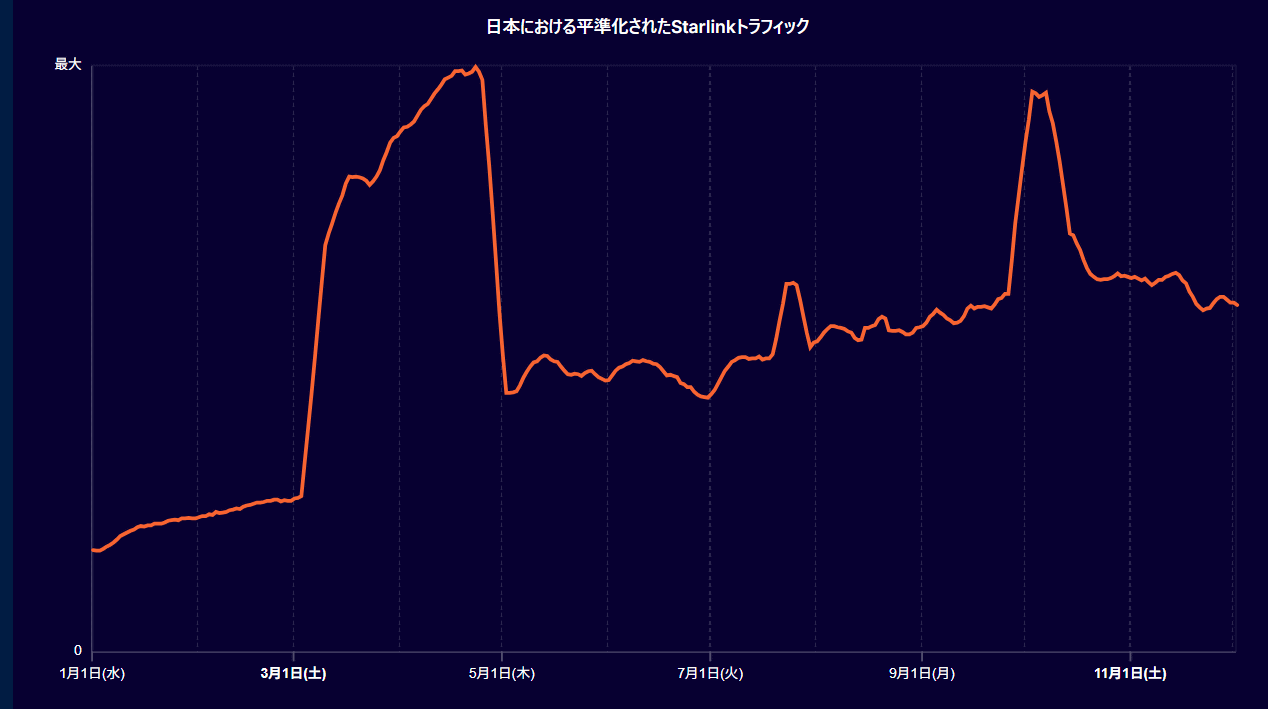
And here's what it looks like in Japan: The overall trend is the same, but there are big increases around April and October.
Bot and crawler traffic trends
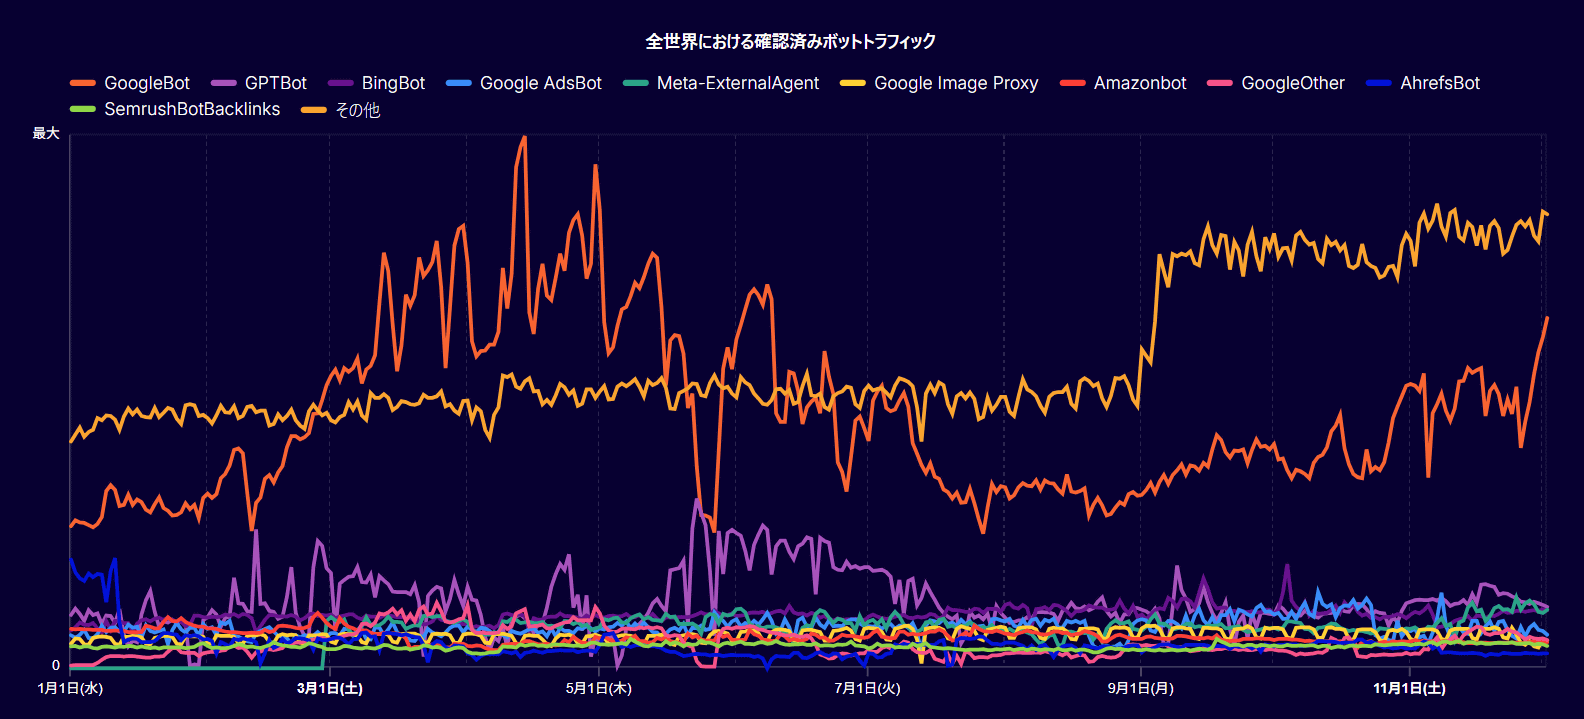
Cloudflare Radar's Bots Directory tracks hundreds of confirmed bots divided into over a dozen categories, with each bot showing different access patterns. Here, we show the daily access volume of the top 10 confirmed bots with the highest traffic volume, as well as the remaining bots grouped under 'Other.' The most popular bot is GoogleBot, followed by GPTBot.
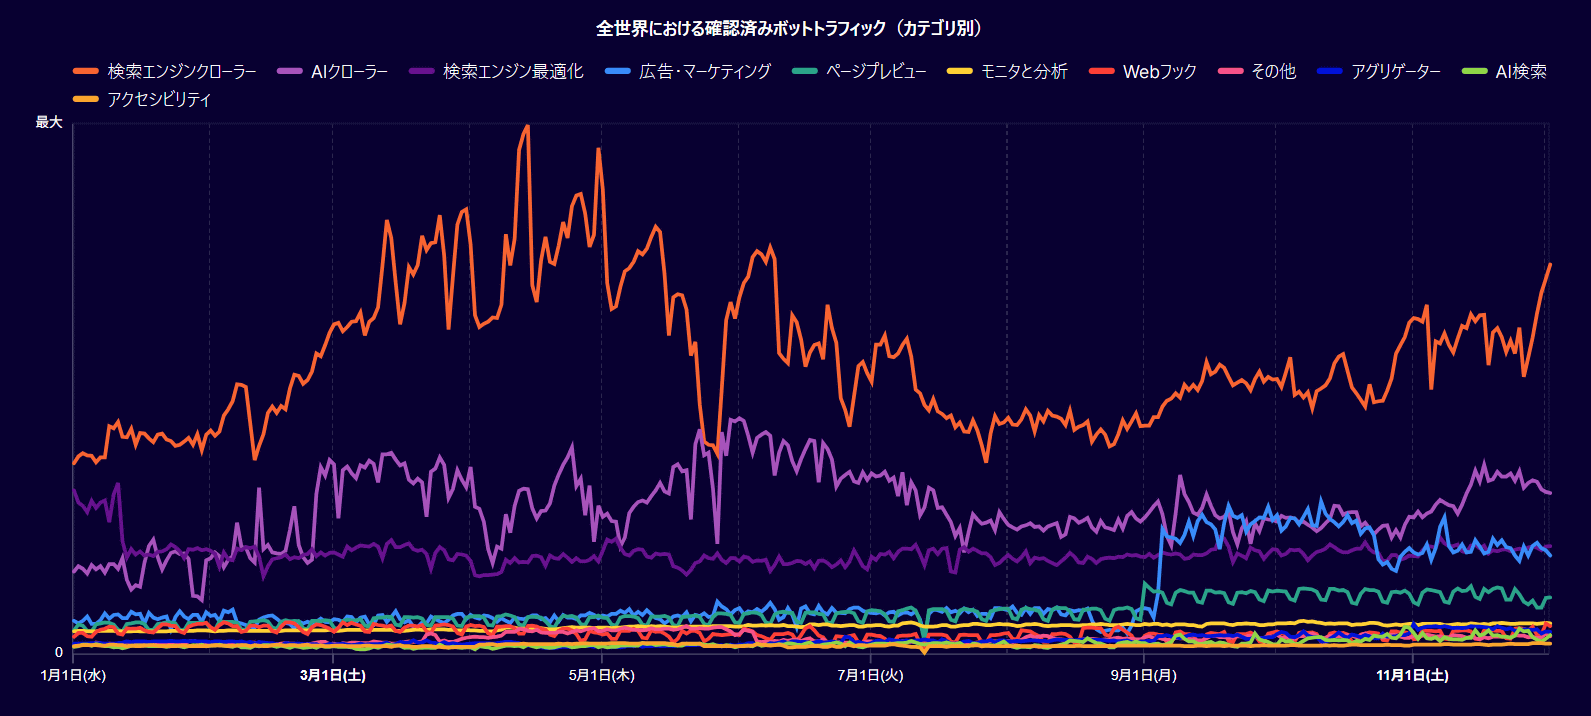
By category, search engine crawlers were the most common among the confirmed bot categories, followed by AI crawlers. Search engine optimization bots remained stable, but advertising and marketing bots saw a sharp increase in early September.
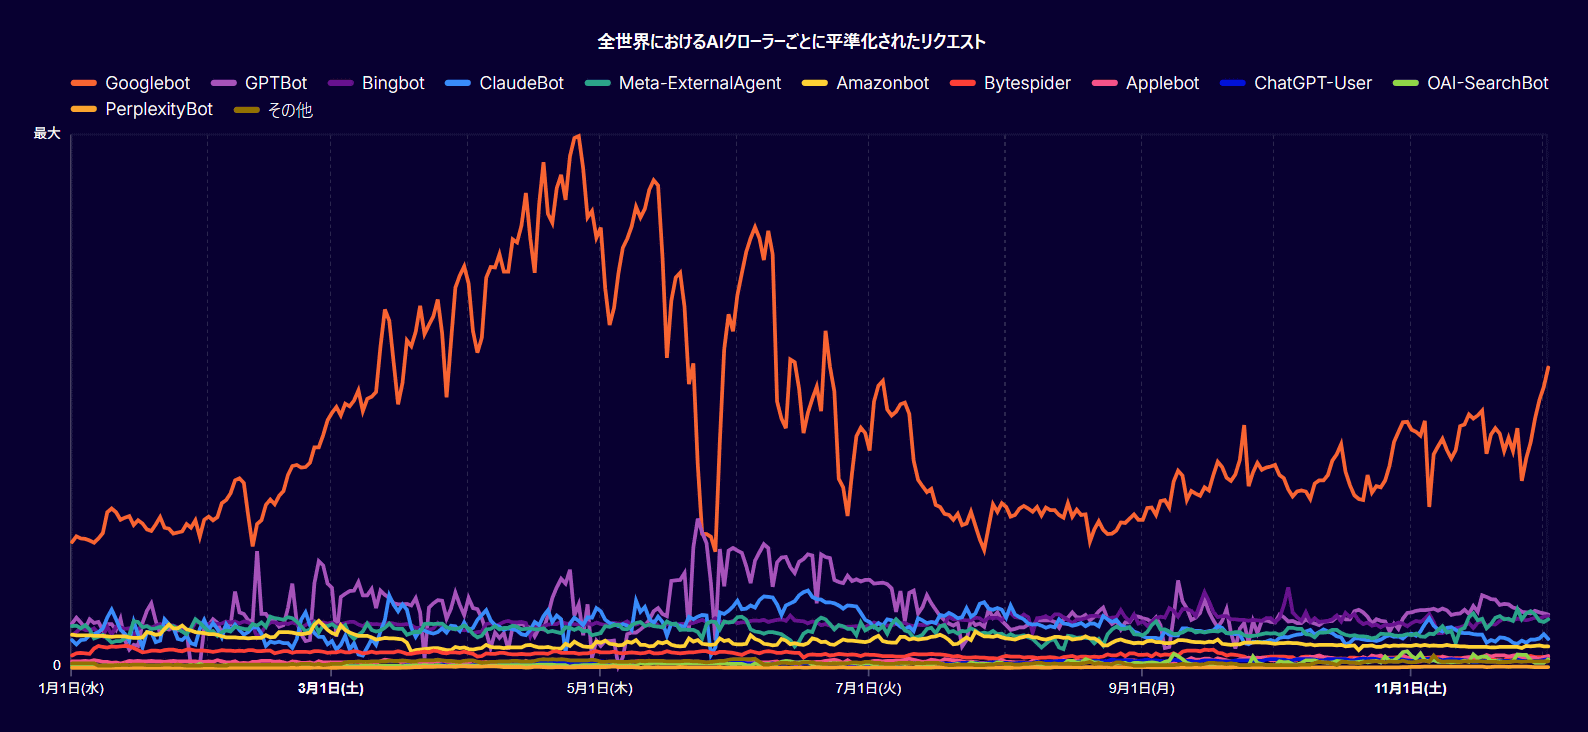
Cloudflare states, 'Throughout 2025, news coverage has focused on AI bots and crawlers voraciously consuming content to train ever-evolving models.' The graph below shows the trend in traffic volume, smoothed out for major bots and crawlers. Googlebot dominates, peaking around May. Other AI bots and crawlers, such as GPTBot, Bingbot, ClaudeBot, and Meta-ExternalAgent, remain roughly flat.
Comparison between iOS and Android
It's estimated that by 2025, more than 70% of the world's population will be using smartphones, making them the primary means of internet access in many countries. It's been determined that the majority of traffic in approximately 117 countries and regions will come from mobile devices in 2025. The global distribution of mobile and desktop device usage for traffic observed by Cloudflare in 2025 looks like this: Globally, mobile accounts for 43% of traffic, but in Japan, where smartphone penetration is high, mobile traffic accounts for 58%, exceeding desktop traffic.
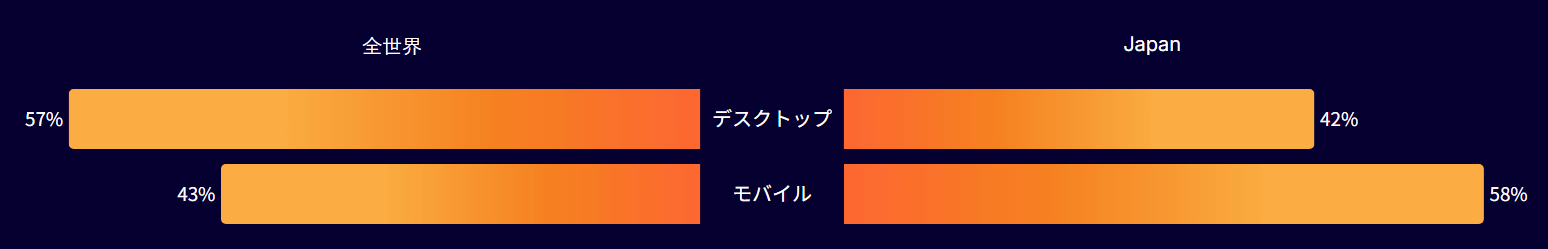
Globally, Android accounts for 65% of mobile device traffic, while iOS accounts for 35%. However, in Japan, Android accounts for 43% of traffic, while iOS accounts for 57%.

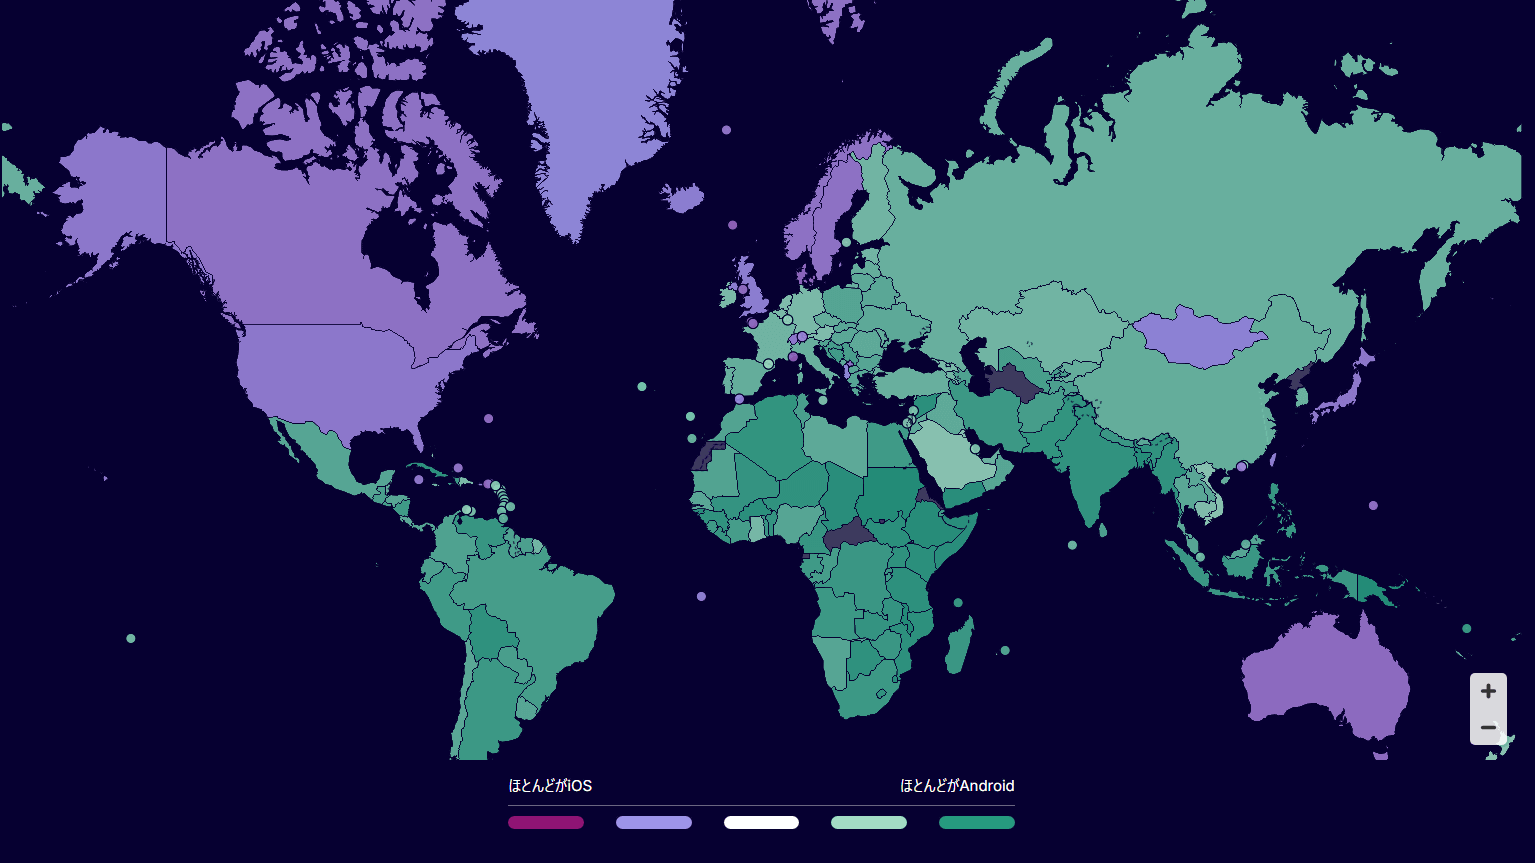
Here's a global map showing the distribution of iOS and Android traffic. Darker purple indicates more iOS users, while darker green indicates more Android users. We can see that iOS dominates in Japan, North America, the UK, Mongolia, Northern Europe, and Australia, while Android dominates in most other regions.
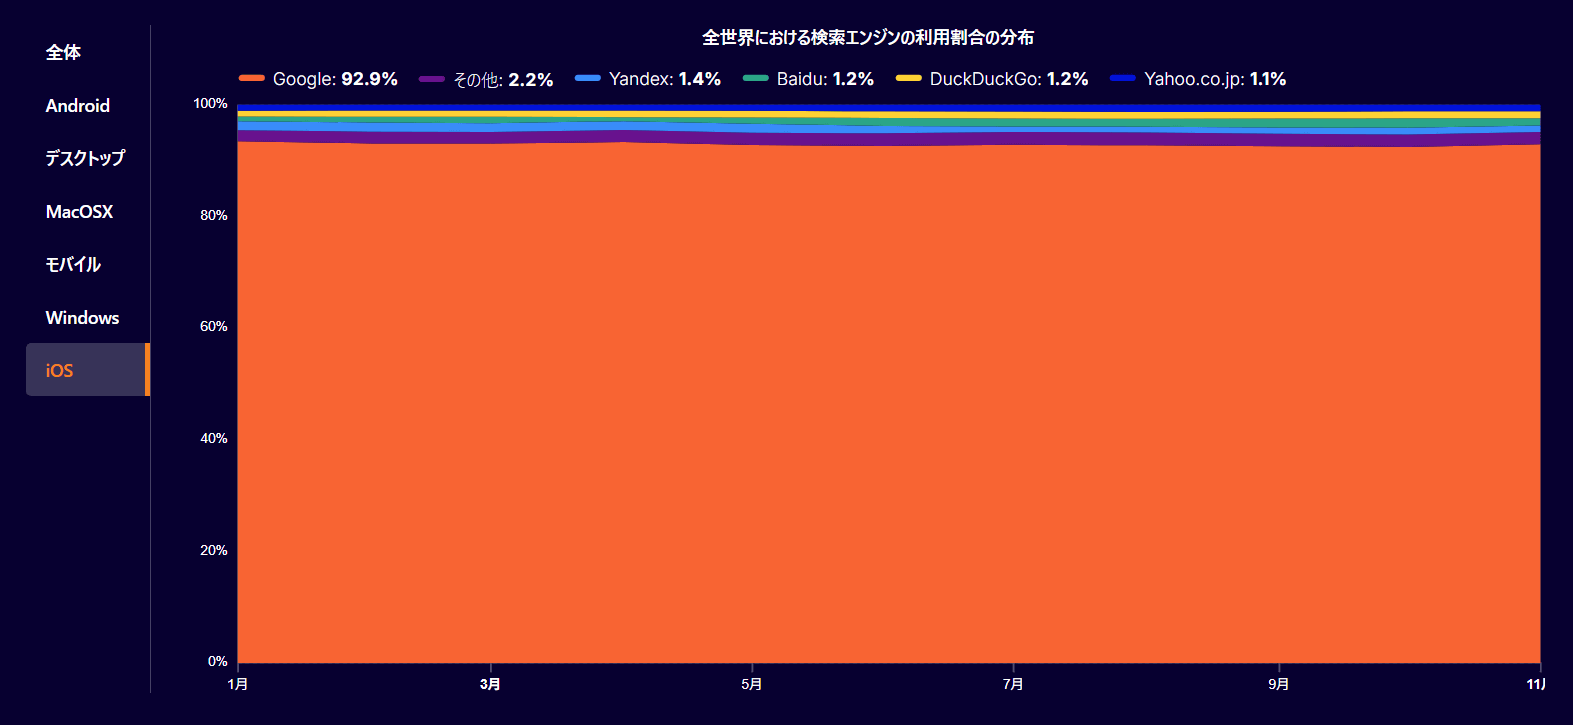
The distribution of search engine usage on iOS is shown below, with Google accounting for over 90%. It's interesting to note that while this is a global distribution, the Japanese search service Yahoo.co.jp also ranks in at 1.1%.
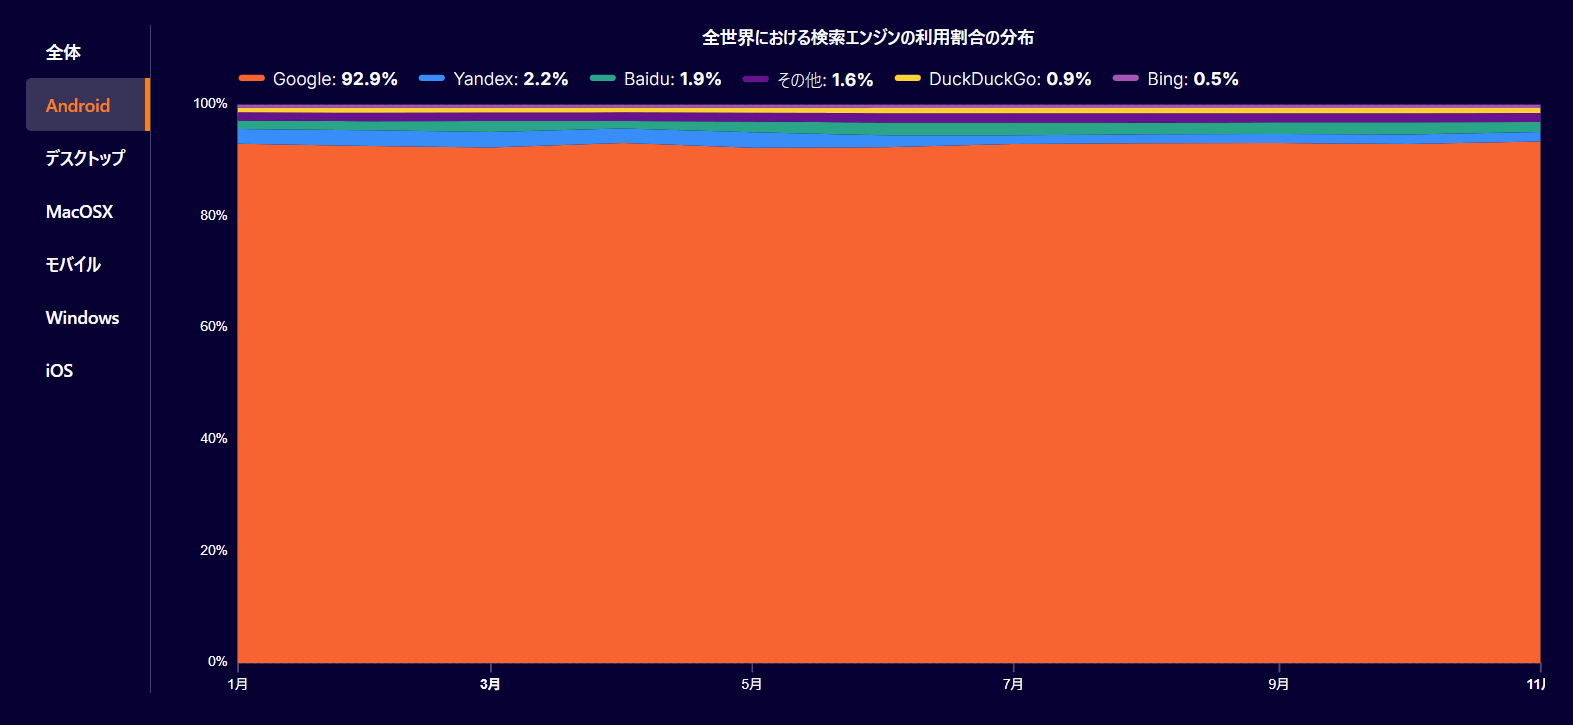
The distribution of search engine usage on Android is roughly the same, except that Yahoo.co.jp did not make the ranking.
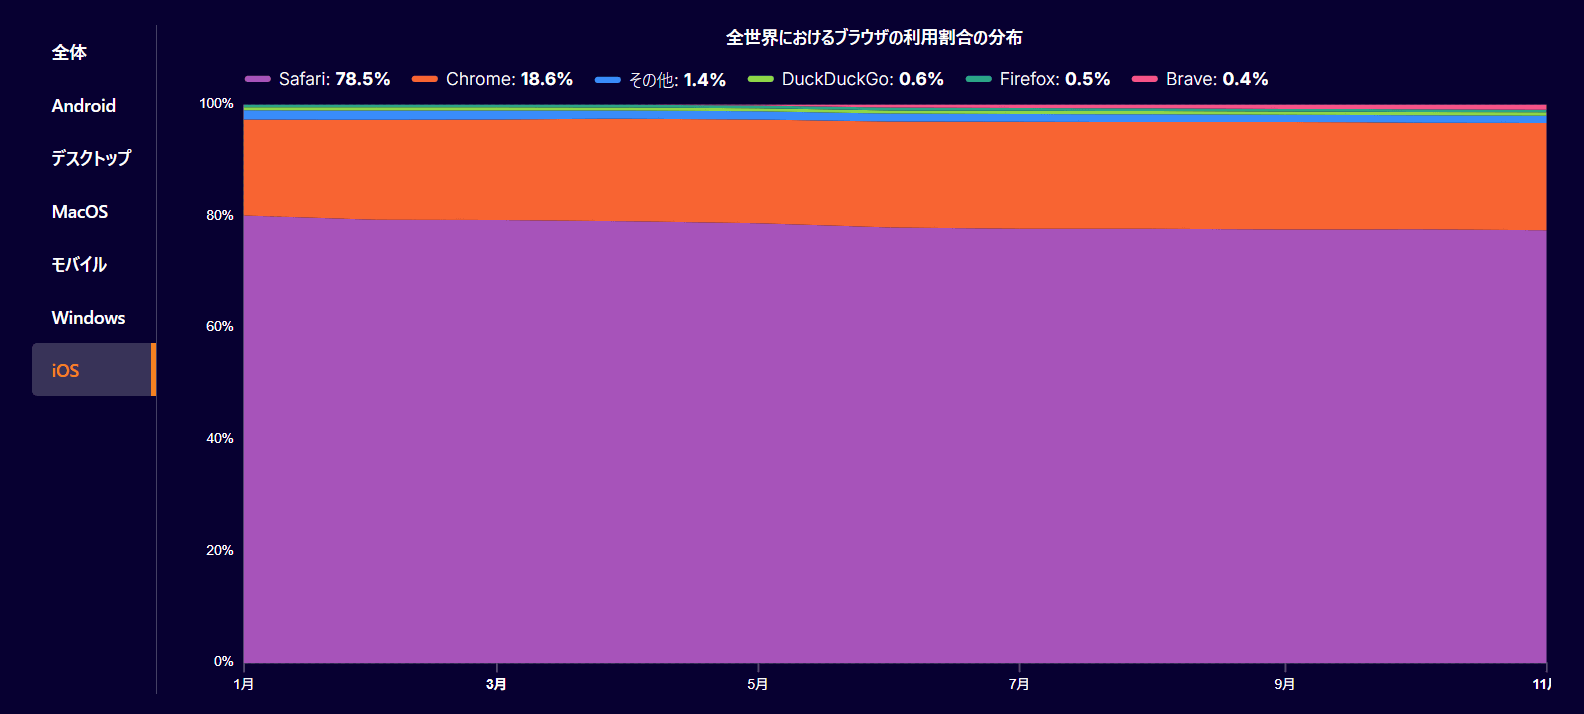
The worldwide distribution of browser usage on iOS is as follows: Safari is unsurprisingly the top with 78.5% of users, followed by Chrome with 18.6%. In third place is DuckDuckGo with 0.6%.
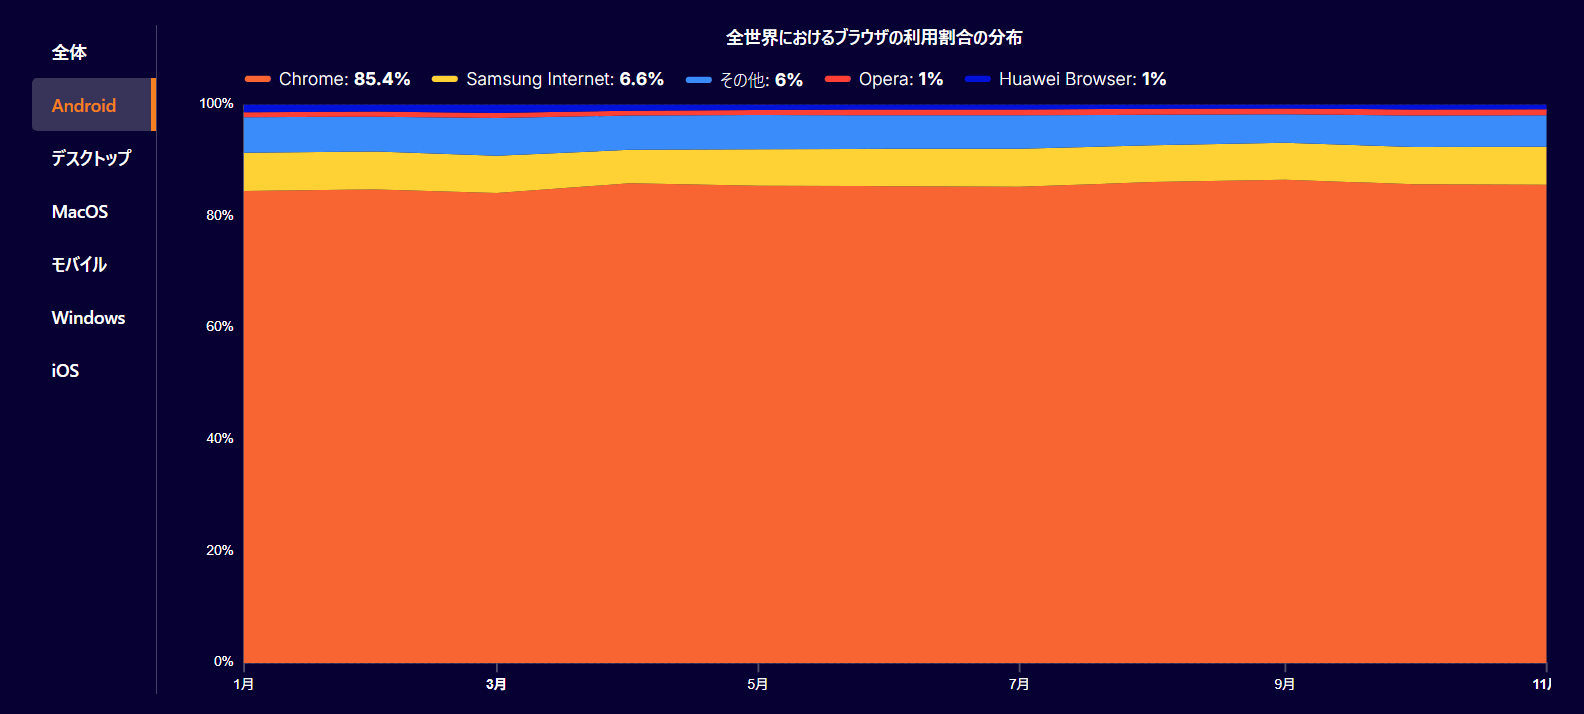
On Android, Chrome came in first with 85.4%, followed by Samsung Internet with 6.6%, and Opera and Huawei Browser, both with 1% each.
Cloudflare's report also compiles a variety of other internet statistics, so if you're interested, be sure to check it out.
Related Posts:


in Web Service, Posted by log1i_yk