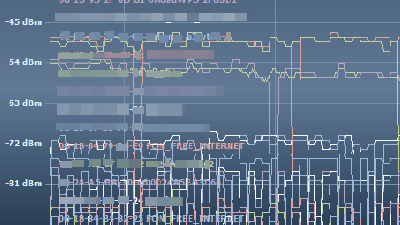
A free application "OpenSignal" which can measure & share information on the actual radio coverage ratio of mobile phone base stations

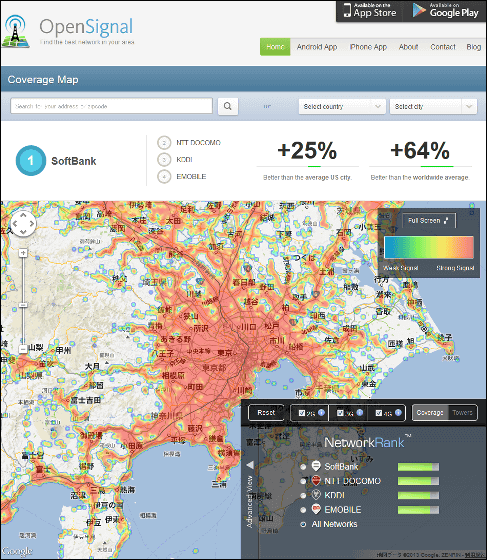
By checking the current communication situation in detail and uploading everyone's data on the cloud, it is possible to share the actual radio wave condition on a global scale "OpenSignal"is. What is the situation of the base station where I am? Is there a Wi - Fi spot nearby? How much does the speed come out? It is possible to grasp the detailed information such as such as freely.
3G and 4G LTE Cell Coverage Map - OpenSignal
http://opensignal.com/
◆ Installation
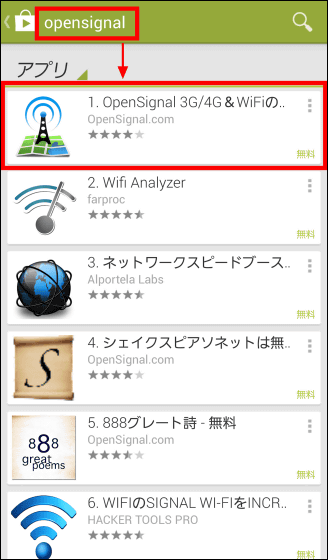
Tap the following application which searches for "OpenSignal" in the search window of "Play store" and comes out. OrThis pageAccess to.
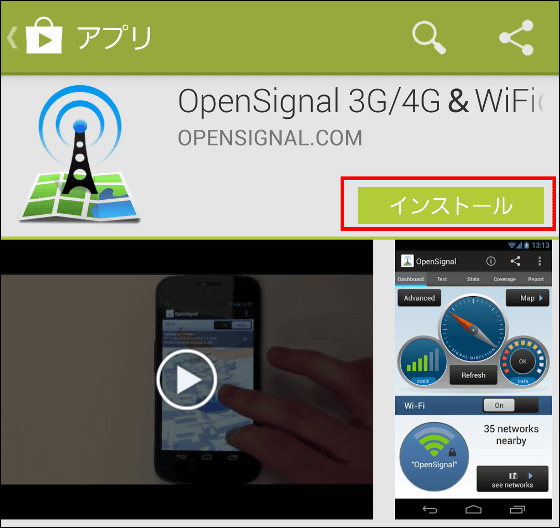
Tap "Install".
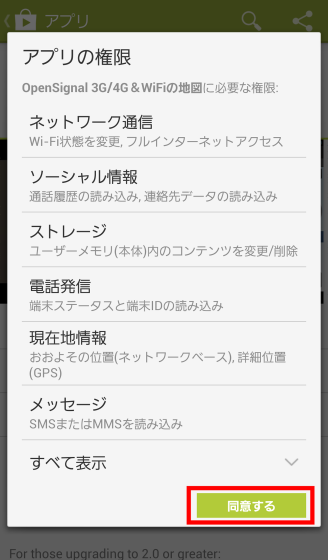
Tap "I agree".
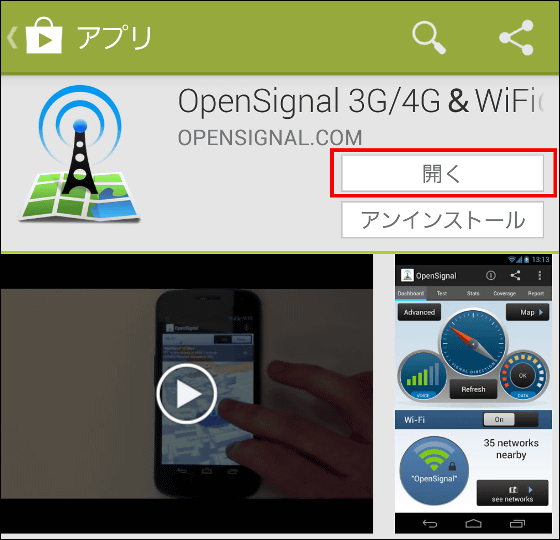
Tap "Open" when installation is completed.
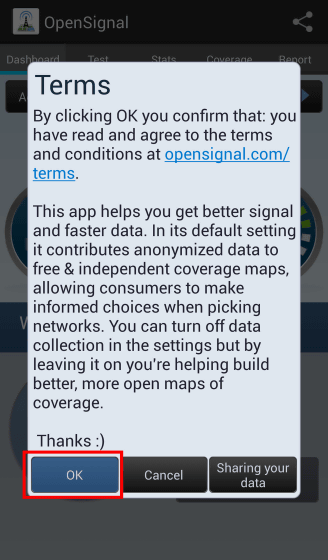
"Terms" is displayed at the first start, so tap "OK".
Installation is complete.
◆ Menu structure
There are five menus in this application in roughly divided.
· Dashboard
· Test
· Stats
· Coverage
· Report
The explanation of each screen is as follows.
◆ Dashborad screen
It is the "Dashboard" screen which becomes the main screen.
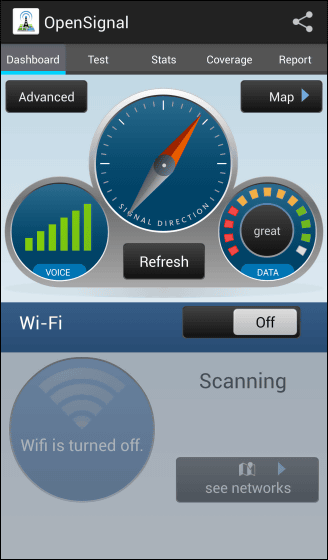
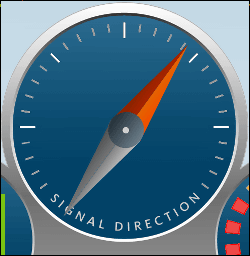
A thing like this compass magnet shows an orientation of the base station from the current position.
It shows the speed of data communication. The faster the response time to ping, the better the evaluation will be.
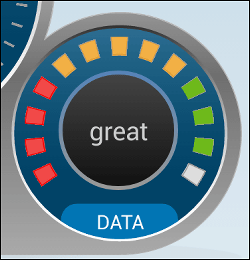
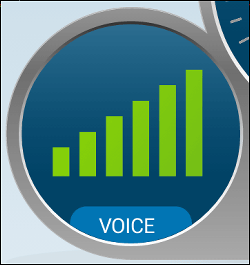
It shows the strength of radio waves.
Indicates Wi-Fi connection status. In this screen it is indicated as not connected.
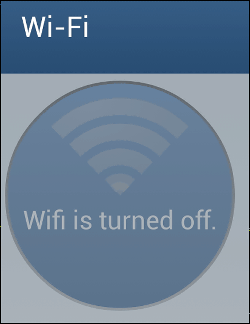
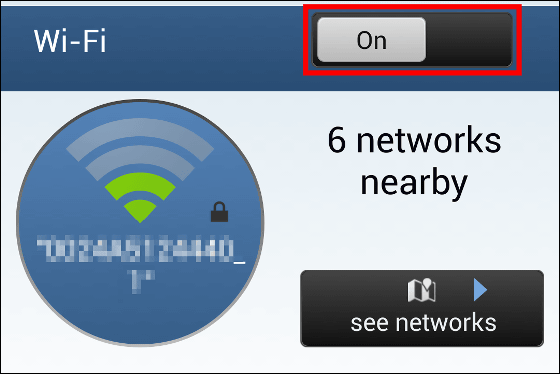
From the Dashboard screen, you can also control the Wi-Fi of the smartphone itself. Tap on the screen switch to "On" and connected to Wi-Fi. There is also an indication on the screen that "You can receive 6 Wi - Fi radio signals now".
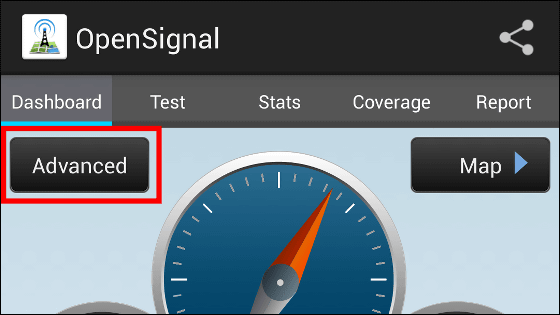
Let's change to a more detailed screen. Tap "Advanced" at the top left of the screen ... ...
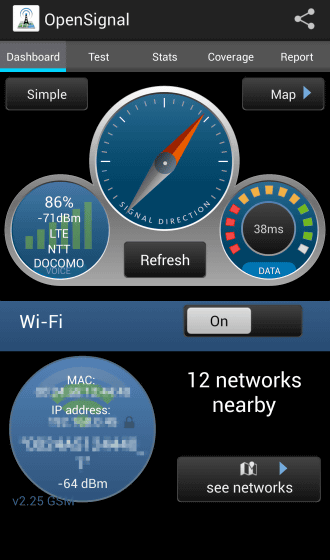
Switch to "Advanced" screen. The intensity of radio waves is -71 dbm, it is displayed that NTT docomo's LTE network is being accessed and the ping response time is 38 ms. In the lower part, "MAC address", "IP address", "Network name" of the Wi-Fi connection are displayed.
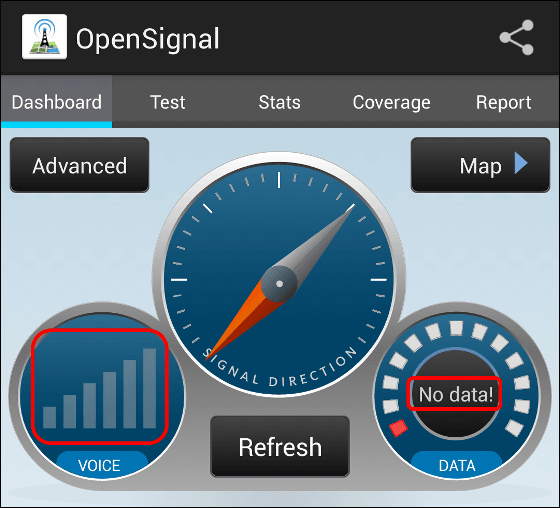
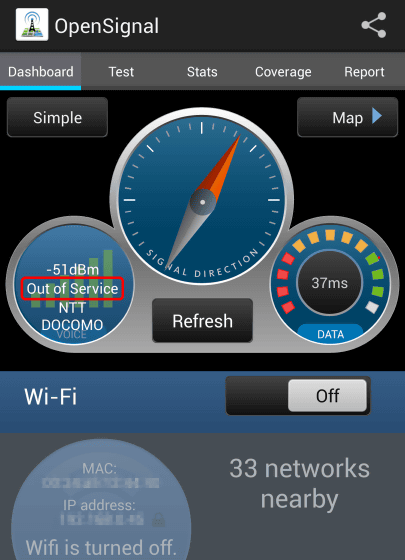
By the way, when you are out of range, it will be displayed like this.
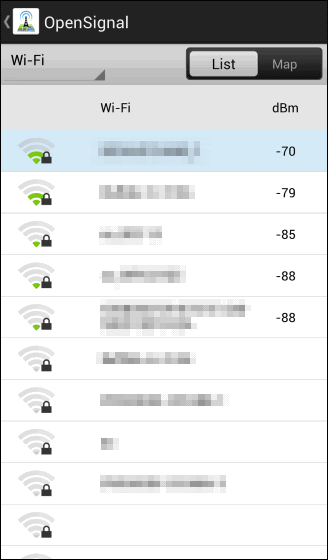
Tap "see networks" at the bottom right of the Dashboard screen to display a list of nearby Wi-Fi networks along with the radio strength.
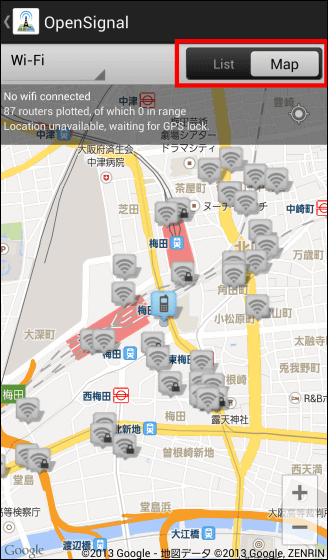
Tap "Map" at the top right of the screen to display the nearby Wi - Fi network on the map.
◆ Test screen
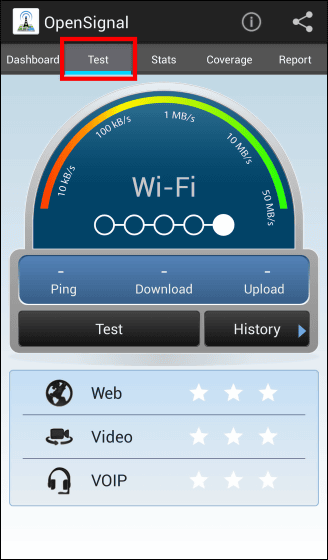
Return to the Dashboard screen and tap "Test" at the top or swipe the screen to the left to enter the "Test" screen.
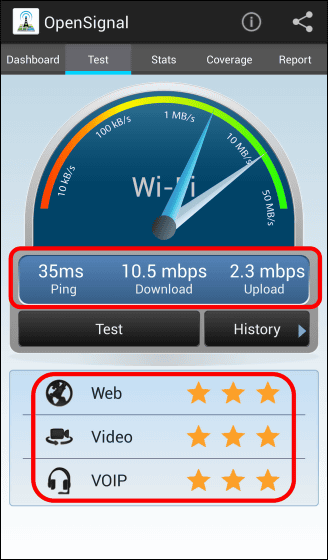
Tap "Test" in the center of the screen to start measuring the network. Measurements are made in the order of "Ping", "Download", "Upload" ... ...
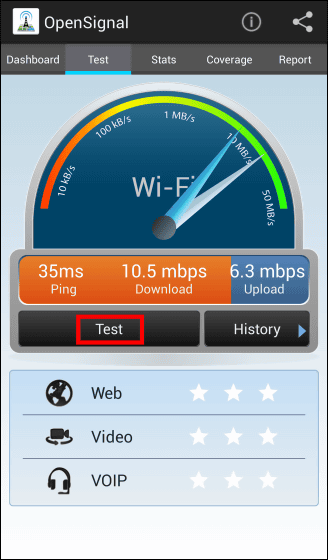
Diagnosis is completed if color is displayed on the bottom ☆ mark. In this measurement, the ping response was 35 ms, the download speed was 10.5 mbps, and the upload speed was 2.3 mbps.
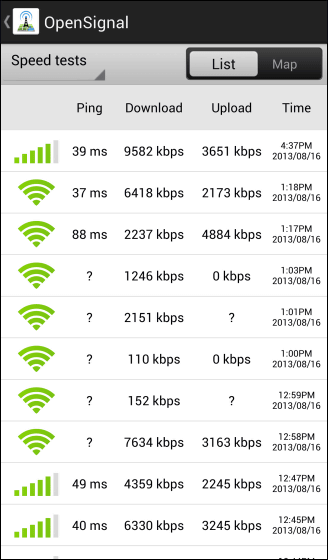
By tapping "History", you can check the history of measurement results so far.
◆ Stats screen
Next is an introduction to the "Stats" screen. Tap "Stats" at the top of the screen or swipe the screen to display the screen as below.
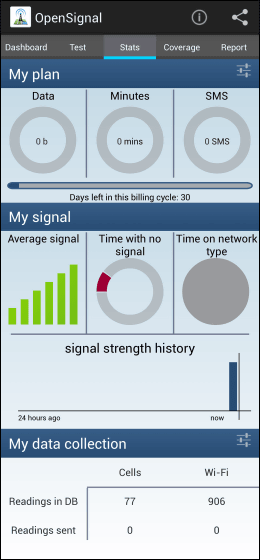
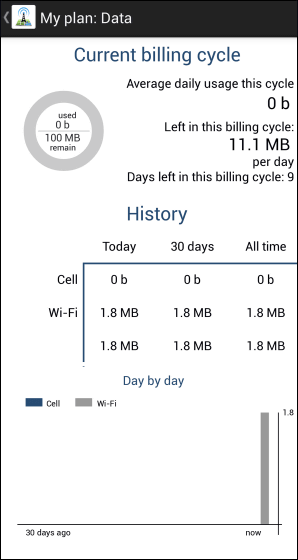
In "My Plan", the status of "data communication volume", "call duration", and "number of SMS transmissions" at the present time is displayed as a donut graph. Tap the graph to switch to the detailed display.
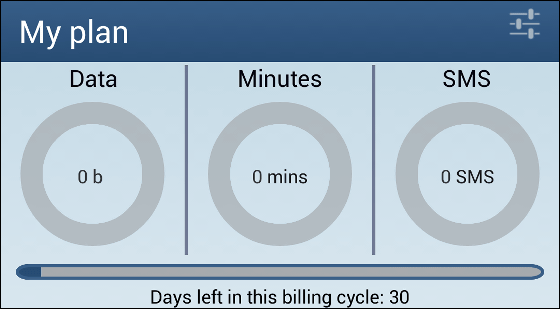
The details screen of "data communication volume" looks like this.
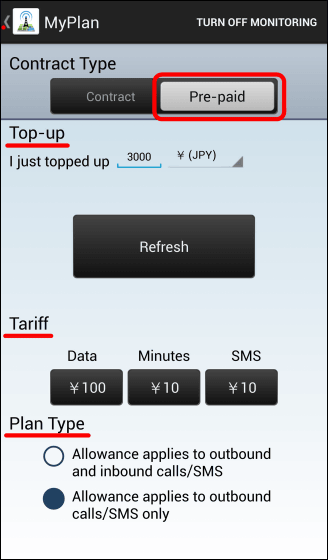
If you change "Contract Type" to "Pre-paid", it will change to such a screen. It is literally the screen in the case of a prepaid contract. From the top, make settings for "charged amount", "communication / call charge unit price", "whether call charges will be incurred even when receiving incoming calls". By the way, in English, "charge" of charge is called "top up".
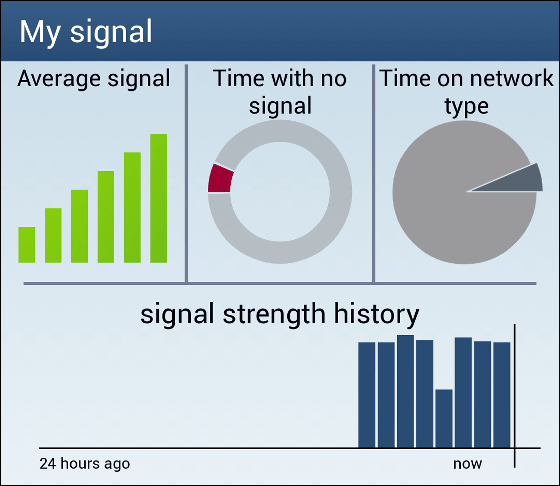
In "My Signal", the average value of the radio field strength, the ratio of the out-of-service time, the percentage of the network used, the history graph of the radio wave level are displayed.
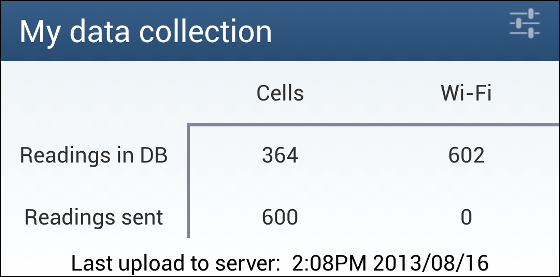
In "My data collection", the number of data acquired using this application and the number of data sent to OpenSignal are displayed.
◆ Coverage screen
Tap "Coverage" to display a map centered on the current position. On the map, the communication strength analyzed based on the data sent from the user is mapped.
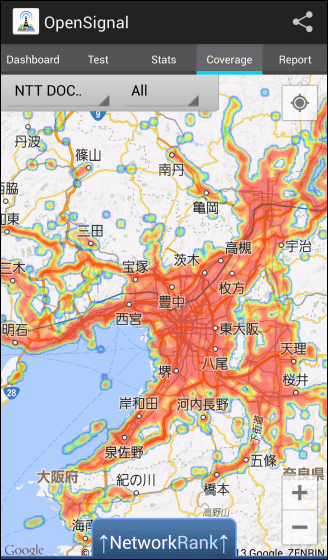
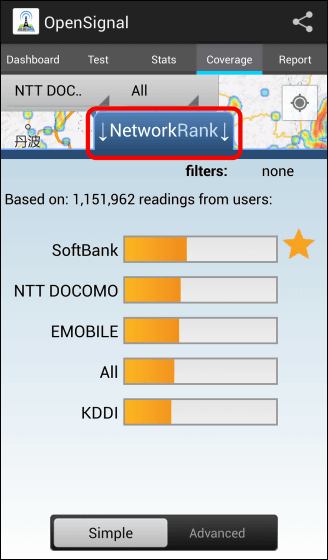
Tap "NetwordRank" at the bottom of the screen to display the rankings for each carrier.
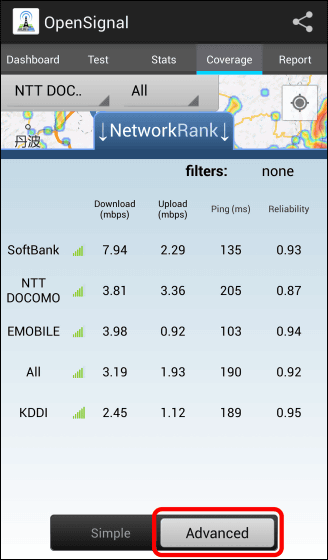
Switch to "Advanced" and the details will be displayed.
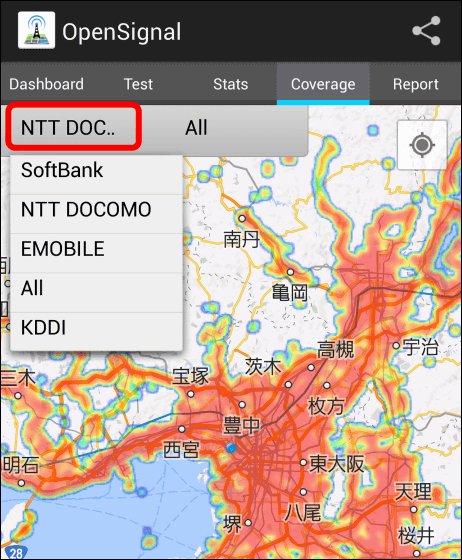
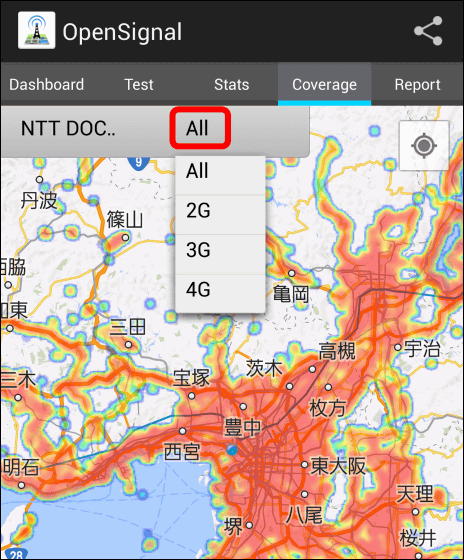
You can also select carriers from the upper left pull-down and filter them for display.
It is also possible to filter by communication standards.
◆ Report screen
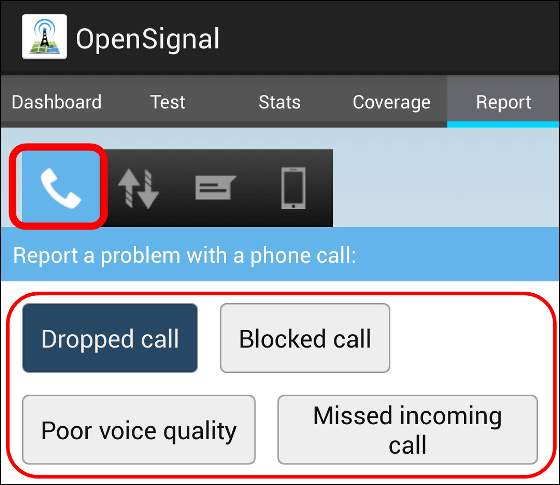
From the Report screen, when there is a problem with the quality of radio waves, various reports can be made to OpenSignal Corporation. This is when there is a problem with the call. You can choose "Call disconnected", "Call is blocked", "Sound quality is bad", "Incoming call has expired", and so on.
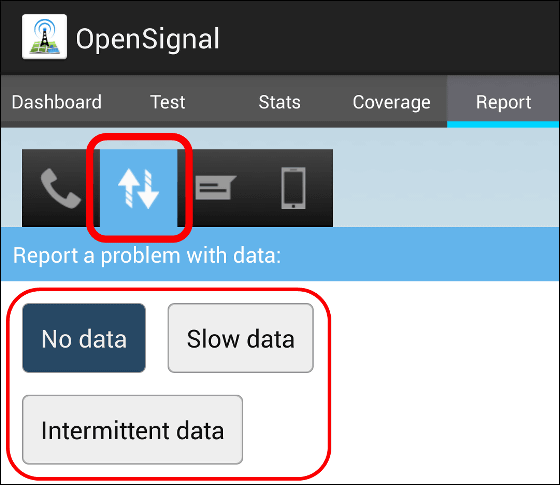
In the field of data communication, you can choose "No data communication", "Low communication speed", "Intermittent communication".
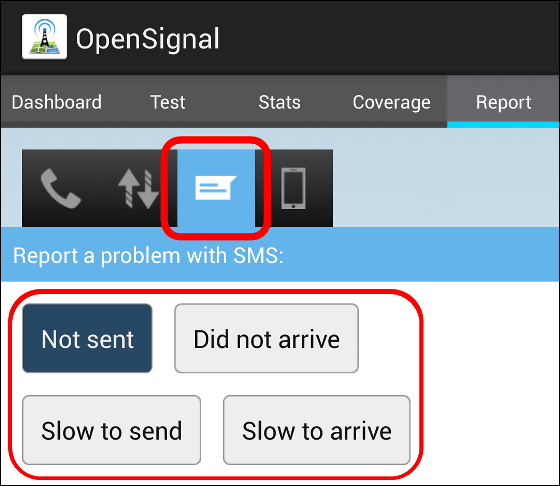
In the item of SMS, you can choose "SMS could not be sent", "did not arrive", "sent late", "slow reception".
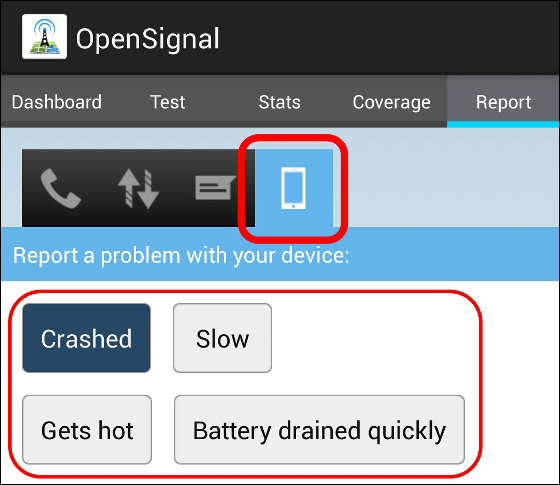
In the item of the device you can choose "crashed" "slow (motion)" "getting hot" "fast battery drain".
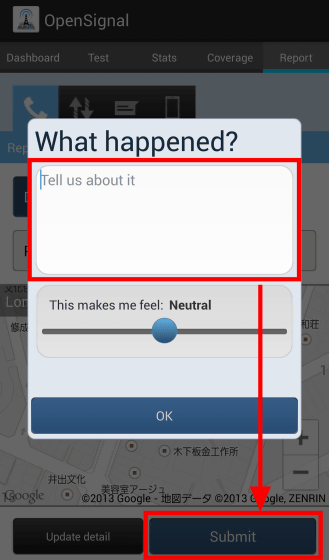
If you have any comments or explanations, fill in "Update detail" and tap "Submit" at the end to send the contents.
◆ Actually taken out and used
I brought it off the office and decided to try using OpenSignal. It was Osaka station that I came.

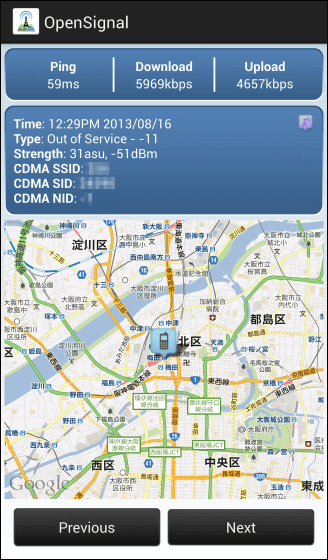
I opened the Dashboard. Where the radio condition is "Out of Service", LTE has not been received ......?
I measured it.
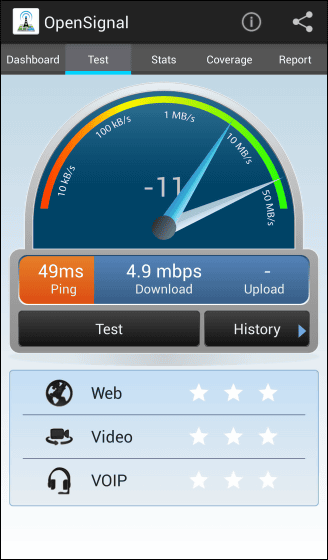
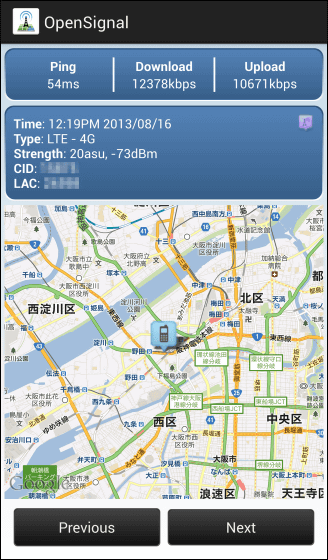
It was the best that counted several times. The ping response was 59 ms, the download speed was 5969 kbps, and the upload speed was 4657 kbps. However, as I moved a little, I was able to connect with LTE, so I could confirm that it is changing in that occasional situation.
The result when connecting with LTE is kore. It seems to be slower than the original speed, but even though it is still 5 times slower than the previous download speed.
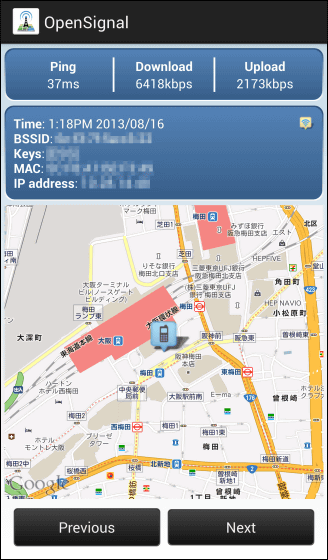
Let's connect to Wi-Fi next time. Turn Wi-Fi on in Dashboard and tap "see networks" to display Wi-Fi spots in the vicinity.
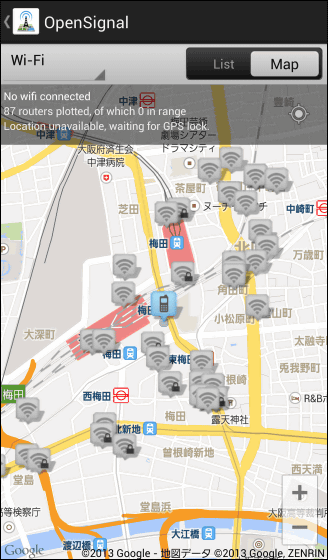
Among them, if there are items actually picking up the radio waves, they will be shown tied in a blue line like this.
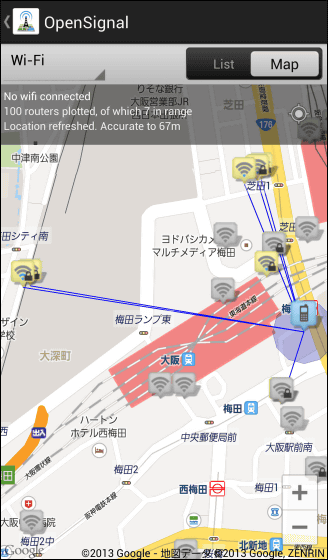
I measured it. I got the result of download 6418 kbps, upload 2173 kbps.
The conclusion
If you do not have a good connection with your smartphone, you may think "Somehow it does not connect ...", but if you launch this application at that time you can check your current situation at a glance and you can find the nearest base station It is quite convenient to be able to do. Moreover, it is a two-bird stone app with one stone that the data acquired by you and everyone's data are accumulated and everyone gets benefit by the analysis result
Although some functions are omitted than the Android version,Japanese version of iOS applicationIPhone users can also use it because it has been released.
Related Posts:

